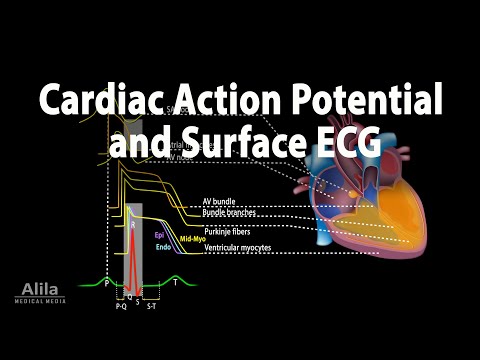
Correlation between Cardiac Action Potential and ECG, Animation
3-Second Blueprint (English)
- Cardiac action potentials travel from the SA node through the AV node and Purkinje fibers via transmembrane ion fluxes.
- Contractile myocytes sustain an ion-balanced plateau phase during contraction between depolarization and repolarization.
- Surface ECG maps cellular events: P wave shows atrial depolarization, QRS ventricular depolarization, ST plateau, and T repolarization.
Cardiac Action PotentialSA-AV-Purkinje ConductionMyocyte Plateau PhaseQRS Complex MappingECG Wave Interpretation
3-Sekunden-Fazit (Deutsch)
- Aktionspotenziale wandern durch Ionenströme vom SA-Knoten über den AV-Knoten und Purkinje-Fasern durch den Herzmuskel.
- Kontraktile Myozyten halten während der Kontraktion eine Plateauphase durch ausgeglichenen Einstrom und Ausstrom positiver Ionen.
- Das EKG bildet Zellprozesse ab: P-Welle zeigt Vorhof-, QRS Kammerdepolarisation, ST die Plateauphase und T die Repolarisation.
Kardiales AktionspotenzialSA-AV-Purkinje-ReizleitungMyozyten-PlateauphaseQRS-Komplex-ZuordnungEKG-Wellenanalyse
Note / Hinweis: Blueprints are AI-generated educational summaries (0% Politics · 0% Religion · 0% Brainrot) and do not constitute medical, legal, or financial advice. / KI-generierte Zusammenfassung zu Bildungszwecken – ersetzt keine medizinische, rechtliche oder finanzielle Fachberatung.