StatQuest: Principal Component Analysis (PCA), Step-by-Step
3-Second Blueprint (English)
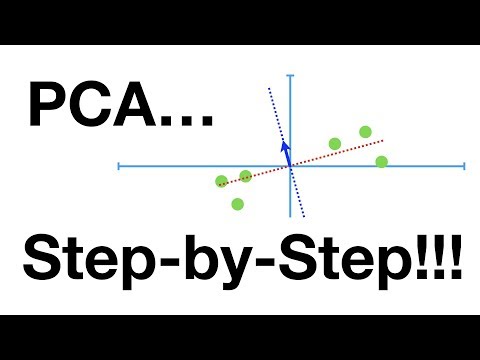
- By the Pythagorean theorem, PCA fits PC1 through centered data by maximizing squared distances of projections from the origin.
- Singular Value Decomposition yields loading scores showing each variable's weight and eigenvalues measuring captured variation.
- Projecting samples onto top principal components and checking the scree plot reveals clusters while gauging 2D plot accuracy.
Principal Component Analysis (PCA)Singular Value Decomposition (SVD)Loading scoresEigenvalues & varianceScree plot evaluation
3-Sekunden-Fazit (Deutsch)
- Nach Pythagoras findet PCA die Hauptkomponente PC1 durch Maximierung der quadrierten Projektionsabstände zum Ursprung.
- Singulärwertzerlegung (SVD) liefert Ladungswerte für Variablengewichte sowie Eigenwerte als Maß der erklärten Varianz.
- Die Projektion auf PC1 und PC2 samt Scree-Plot zeigt Datencluster und wie genau die 2D-Darstellung die Streuung abbildet.
Hauptkomponentenanalyse (PCA)Singulärwertzerlegung (SVD)Ladungswerte (Loading Scores)Eigenwerte & VarianzScree-Plot-Analyse
Note / Hinweis: Blueprints are AI-generated educational summaries (0% Politics · 0% Religion · 0% Brainrot) and do not constitute medical, legal, or financial advice. / KI-generierte Zusammenfassung zu Bildungszwecken – ersetzt keine medizinische, rechtliche oder finanzielle Fachberatung.