#297: Basics of the Smith Chart - Intro, impedance, VSWR, transmission lines, matching
3-Second Blueprint (English)
- Complex load impedances like 37 + j55 ohms are normalized by dividing by system impedance (typically 50 ohms) before plotting.
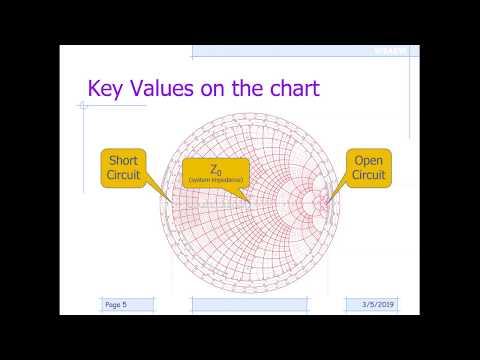
- Concentric circles centered on the Smith Chart trace loci of constant VSWR and complex reflection coefficient magnitude.
- One full revolution around the chart equals a half-wavelength transmission line, repeating antenna impedance every lambda/2.
Smith ChartNormalized impedance (Z/Z0)VSWR & reflection coefficientL-network impedance matchingSimSmith RF software
3-Sekunden-Fazit (Deutsch)
- Komplexe Lastimpedanzen wie 37 + j55 Ohm werden vor dem Eintragen durch die Systemimpedanz (meist 50 Ohm) normiert.
- Konzentrische Kreise um die Diagrammmitte zeigen alle Impedanzen mit identischem Stehwellenverhältnis (VSWR) und Reflexionsfaktor.
- Ein voller Umlauf im Smith-Diagramm entspricht einer halben Wellenlänge Leitungslänge, nach der sich die Impedanz wiederholt.
Smith-DiagrammNormierte Impedanz (Z/Z0)VSWR & ReflexionsfaktorL-Glied-ImpedanzanpassungSimSmith-Software
Note / Hinweis: Blueprints are AI-generated educational summaries (0% Politics · 0% Religion · 0% Brainrot) and do not constitute medical, legal, or financial advice. / KI-generierte Zusammenfassung zu Bildungszwecken – ersetzt keine medizinische, rechtliche oder finanzielle Fachberatung.