#274: Smith Chart Basics: Impedance and Admittance curves and conversion
3-Second Blueprint (English)
- Normalized Smith charts map complex RF impedance (R + jX) onto orthogonal resistance and reactance circles centered at 1.0 (50 Ω).
- Varying series capacitance or a 0.5 μH inductor traces along a constant-resistance circle without changing the 50 Ω real part.
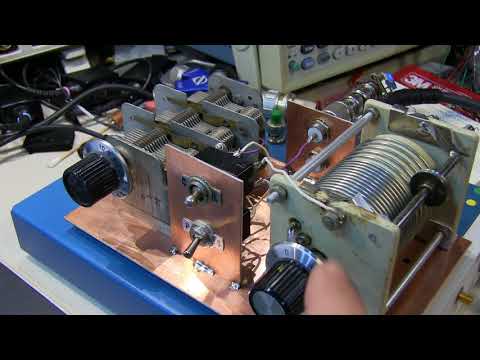
- Live Vector Network Analyzer sweeps at 10 Ω, 25 Ω, and 50 Ω illustrate resistive shifts and impedance-to-admittance conversion.
Smith ChartVector Network Analyzer (VNA)Complex Impedance (R + jX)Admittance Conversion50-Ohm Termination
3-Sekunden-Fazit (Deutsch)
- Normierte Smith-Diagramme bilden komplexe HF-Impedanzen (R + jX) auf orthogonale Widerstands- und Reaktanzkreise um 1,0 (50 Ω) ab.
- Variable Serienkapazitäten oder eine 0,5-μH-Spule folgen einem Kreis konstanten Widerstands bei unverändertem 50-Ω-Realteil.
- Live-Messungen am VNA bei 10 Ω, 25 Ω und 50 Ω zeigen Widerstandsverschiebungen sowie die Impedanz-Admittanz-Umrechnung.
Smith-DiagrammVektor-Netzwerkanalysator (VNA)Komplexe Impedanz (R + jX)Admittanz-Umrechnung50-Ohm-Abschlusswiderstand
Note / Hinweis: Blueprints are AI-generated educational summaries (0% Politics · 0% Religion · 0% Brainrot) and do not constitute medical, legal, or financial advice. / KI-generierte Zusammenfassung zu Bildungszwecken – ersetzt keine medizinische, rechtliche oder finanzielle Fachberatung.